
I will discuss the What Is the Relative Strength Index (RSI), a widely employed momentum oscillator in technical analysis. By quantifying the speed and change of price movements, RSI distinguishes periods of excessive buying or selling pressure, thereby furnishing traders with advance warning of possible trend reversals.
When calibrated correctly, the indicator refines judgment across diverse asset classes—including equities, digital currencies, and foreign exchange—enhancing the precision of entry and exit strategies. Grasping the underlying mechanics of RSI is, therefore, essential for sophisticated market evaluation.
What Is the Relative Strength Index (RSI)?
The Relative Strength Index (RSI) is an anchor in technical analysis devoted to gauging price momentum and prevailing market intensity. Conceived by J. Welles Wilder Jr. in 1978, the RSI discerns excessive valuation or underevaluation by scrutinizing price changes across a designated interval—most frequently, a rolling fourteen-day horizon.
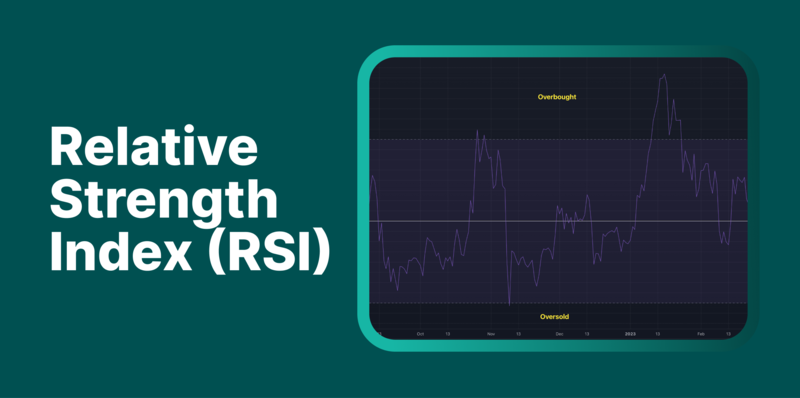
Rendered as a 0-to-100 continuum, the output delineates probabilities: values in excess of 70 flag a probable overbought market, while thresholds beneath 30 reveal likely oversold territory. These demarcations equip market participants to forecast impending trend inflections, thereby situating the RSI as an indispensable component of a disciplined trading arsenal.
RSI Divergence and Its Importance
RSI divergence arises when the price trajectory of a market instrument contradicts the movement of the relative strength index (RSI), thereby flagging a likely alteration in prevailing momentum. Two principal varieties have emerged in practice.
Bullish divergence manifests when the instrument records a lower price low, yet the RSI registers a comparatively higher trough, implying a potential upward pivot; the opposite occurs in bearish divergence, wherein a higher price high coincides with a lower RSI peak, suggesting a likely downward reversal.
Systematic identification of divergences equips market participants to predict prospective trend inflection points, thereby augmenting the precision of discretionary and automated trading strategies.
How RSI Is Calculated
The Relative Strength Index (RSI) quantifies momentum by contrasting average price gains and losses over a designated interval, conventionally set at 14 days. The initial step involves estimating the average gain and average loss within the chosen range. Relative Strength (RS) is then computed by the following ratio:
RS=Average Loss /Average Gain
Finally, the RSI is calculated using the formula:
RSI=100−1001+RSRSI = 100 – \frac{100}{1 + RS}RSI=100−1+RS100
Outcomes of this computation are confined to a spectrum between 0 and 100, facilitating the early detection of overbought (RSI > 70) and oversold (RSI < 30) market phases. Transmuting the look-back interval recalibrates RSI responsiveness; a shorter window intensifies sensitivity, while a longer span tranquilizes fluctuations, accommodating diverse trading modalities.
Limitations of RSI
Though the Relative Strength Index (RSI) effectively highlights overbought or oversold market dynamics, its efficacy is constrained under established trending conditions. In sustained bullish or bearish cycles, the indicator may register extreme levels for protracted intervals, encouraging traders to act ahead of the ultimate price turn.
The index does not supply precise price targets or date-specific projections for trend reversals, and thus should not be interpreted in seclusion. Additional market catalysts—including geopolitical news, macroeconomic data releases, or spike-related volatility—may distort the indicator’s perceived reliability. Consequently, the optimal deployment of RSI involves its integration with complementary technical signatures, coupled with the disciplined application of risk-management frameworks.
Practical Applications of RSI
The Relative Strength Index (RSI) enjoys pervasive application among diverse financial instruments, encompassing equities, foreign exchange, commodities, equity indices, and cryptocurrencies. Practitioners leverage this oscillator to pinpoint overbought or oversold levels, thereby refining trade initiation and closure timing.
Beyond overbought and oversold detection, the RSI elucidates trend persistence, substantiates established momentum dynamics, and reveals prospective reversals via divergence analysis. Integration with complementary methodologies—such as moving averages, defined support and resistance zones, and trend lines—further amplifies analytical precision, curtails exposure to adverse price movements, and augments the risk-return profile across both tactical and strategic investment horizons.
Conclusion
The Relative Strength Index (RSI) represents a robust and commonly employed momentum oscillator, furnishing market participants with a quantifiable gauge of velocity and extremity in recent price action.
By empirical standards, its capacity to delineate overextended buying or selling phases is complemented by a divergence assessment that may presage reversal or consolidation in prevailing trends. Yet normative constraints, including susceptibility to false extremes in volatile or choppy datasets, counsel against unilateral application.
Integration with supplementary oscillators, trend-following indicators, or volumetric verifications, in conjunction with disciplined position sizing and stop-order techniques, augments the RSI’s derivative value. Consequently, it is effectively rendered a disciplined component of holistic decision architecture across equities, digital currencies, and contiguous asset classes.
FAQ
What is the RSI in trading?
The Relative Strength Index (RSI) is a momentum oscillator that measures the speed and change of an asset’s price movements, helping traders identify overbought or oversold conditions.
Can RSI predict trend reversals?
RSI signals potential trend reversals, especially when divergence occurs between price and RSI. However, it does not guarantee exact timing or price levels and works best with other indicators.
Is RSI useful for cryptocurrency trading?
Yes, RSI is widely applied in cryptocurrency markets to analyze volatility, spot overbought or oversold conditions, and assist in timing trades for better profitability.